 RainbowLab
 RainbowLab
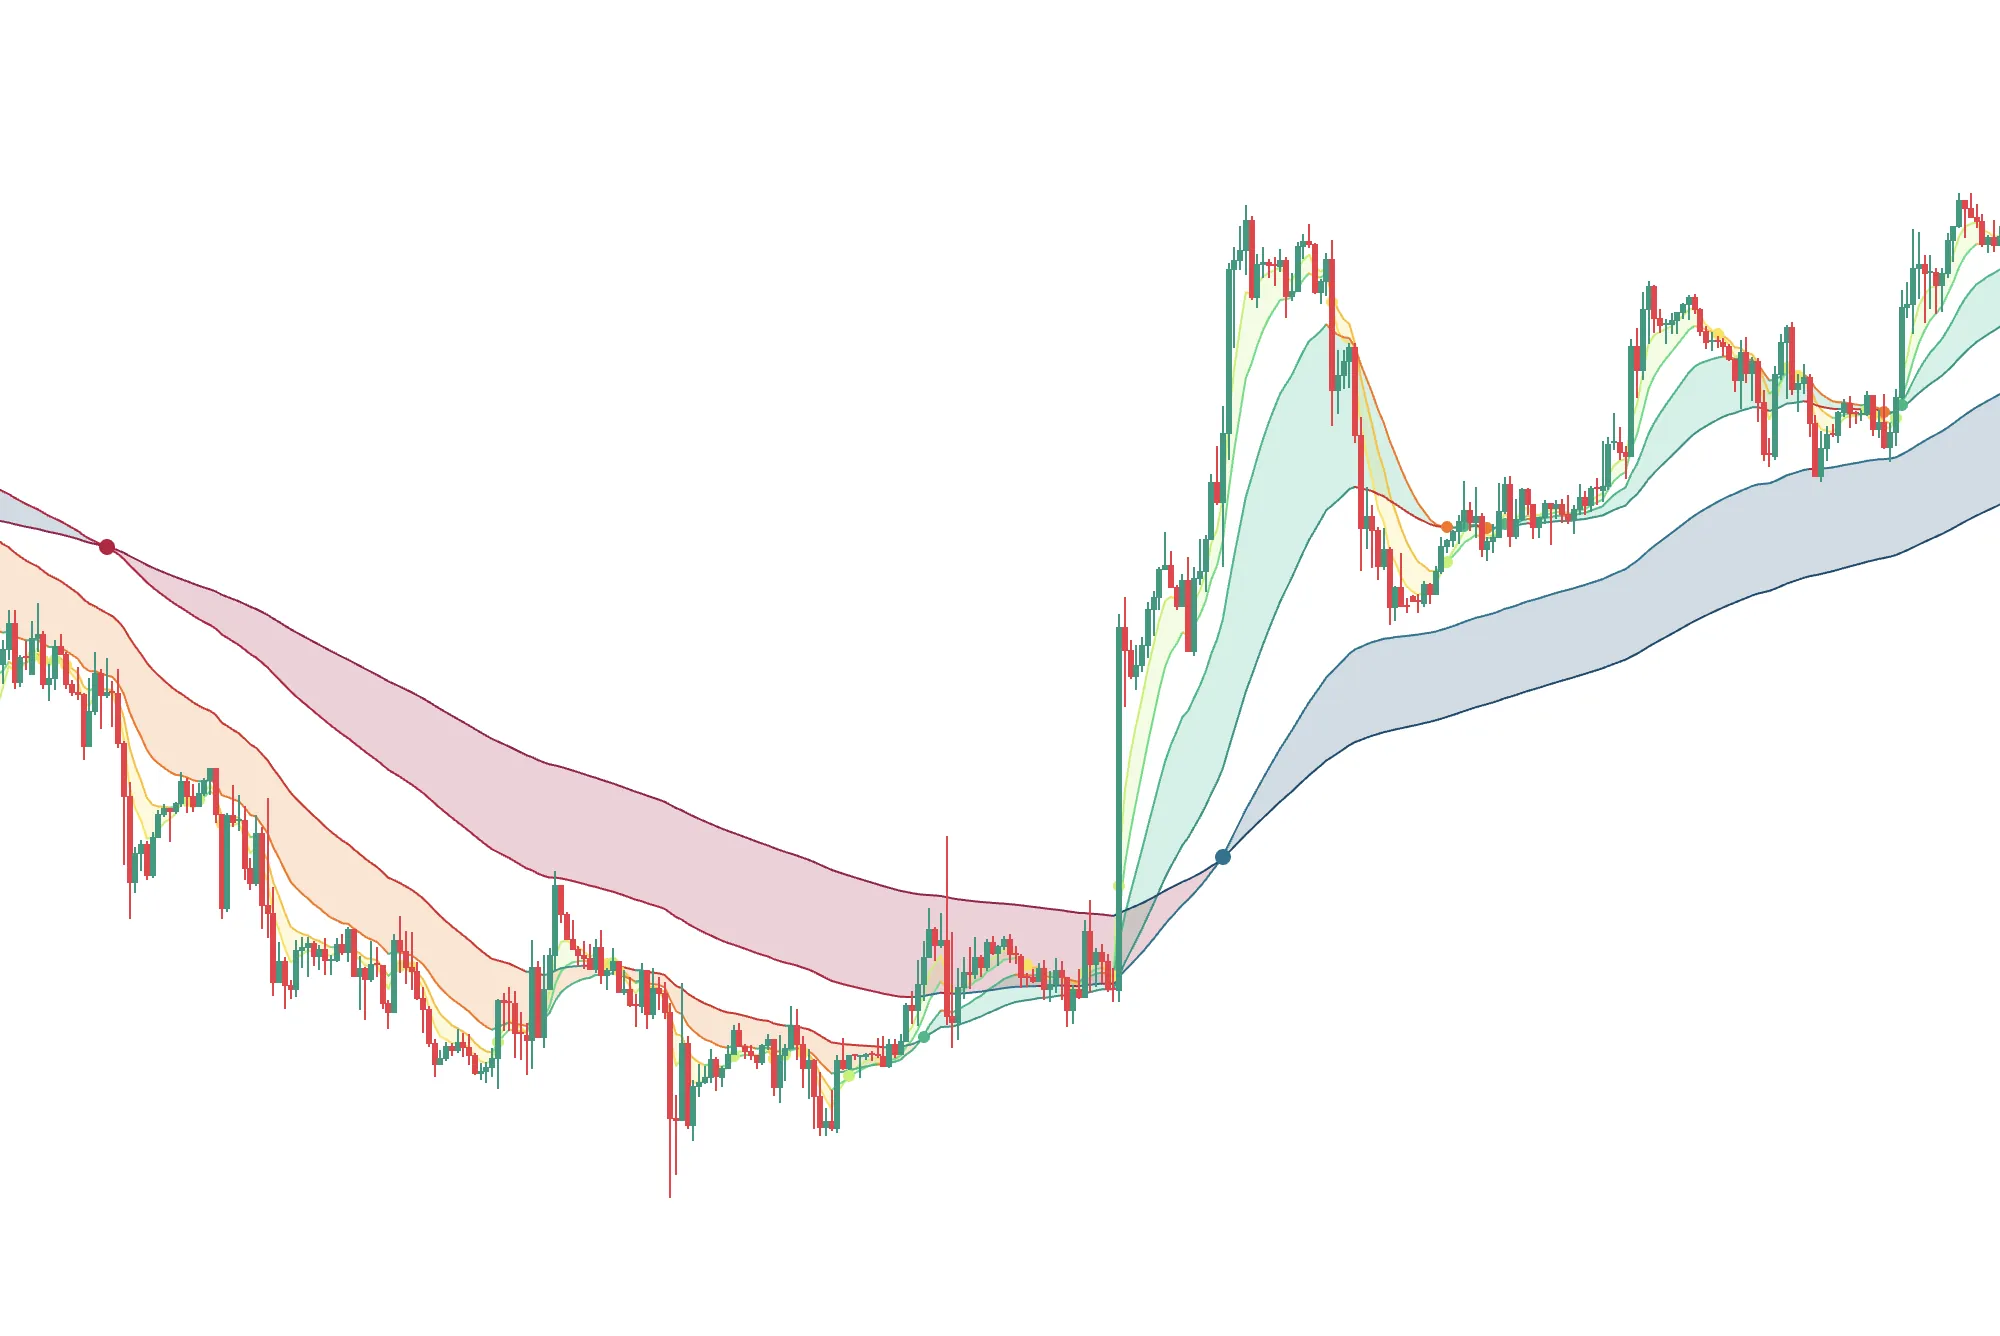
The Trend With Moving Averages Overlay indicator offers a colourful and customisable way to highlight one or multiple trends on a chart. Enjoy the power of moving averages to keep your chart tidy and clear. It is definitely a must-have for clutter-free chart lovers. One indicator, a lot of possibilities.
A moving average is a statistical calculation used to analyse and smooth out price data over a specific period. They are used in this script to spot trends, support and resistance levels by removing short-term price fluctuations.
A trend refers to the general direction in which the price of an asset is moving over a given period.
Traders often use moving averages to identify and confirm trends. For example, when the price of an asset is above its moving average, it can indicate an uptrend, while a price below the moving average may signal a downtrend. When there is no clear trend and the price of an asset goes sideways, the market is considered to be in consolidation.
Crossings between different moving averages can also provide interesting information. For example, when a short-term EMA crosses above a long-term SMA, it can be used as a signal for trend changes or potential trading opportunities.
This script provides the ability to use and configure up to six moving averages. Additionally, clouds and crossing points between those moving averages can also be displayed. Up to five clouds can be added to the chart. Each cloud represents the area in between two moving averages.
The purpose of this indicator is not to reinvent the wheel but to provide an easy way to combine what already exists.
The moving averages used to identify trends are fully customisable.
When it comes to preferences, everyone has their own. This is why the key concept of this indicator is to be customisable. By giving the ability to select different moving averages, to customise them individually and to display them in different ways, this indicator can be adapted to fit everyone’s needs.
This indicator works for any kind of market: Commodity, Crypto, Forex, Index, Stock.
It acts as an overlay, which means that the indicator adds information on top of the chart.
Once added to the chart, one or multiple trends will be displayed and will help you identify opportunities in the markets.
Depending on its configuration, you can use this indicator in different ways. You can, for example, use it to:
→ Identify short-term, medium-term and long-term trends
→ Confirm a trend or a consolidation
→ Highlight a trend strength and momentum
→ Spot potential reversal points
→ Identify support and resistance levels
→ Filter out noise
Those signals can provide potential entry or exit points.
The specific combination of moving averages used can vary based on your preferences and strategy. Common choices include Simple Moving Averages (SMA), Exponential Moving Averages (EMA) and Weighted Moving Averages (WMA). More types of moving averages are also available.
The choice of timeframes for the moving averages also depends on your trading style and the asset being analysed. The goal of this indicator is to provide a comprehensive view of the asset’s trend dynamics and to help you make informed trading decisions.
We encourage you to spend some time customising the indicator for it to fit your needs. Whether you decide to use one or six moving averages, to display clouds between them or not, to use specific period lengths for the calculation of each moving average used, make it your own.
As mentioned, this indicator only highlights trends by using moving averages. It is not a strategy in itself. Other indicators and techniques should be used alongside, to create a strategy and better identify points of interest in markets.
Multiple aspects of this indicator are customisable.
Different types of overlays can be displayed. By using the global settings, you can quickly apply your preferences to all the overlays selected. You can pick amongst:
→ Moving averages (MA) : Display all the moving averages selected.
→ Moving averages clouds (☁️) : Display all the moving averages clouds selected.
→ Moving averages crossings (⇅) : Display all the crossings between moving averages selected.
Every overlay can be selected individually, just select the ones you need. It offers you a high degree of customisation and increases considerably the amount of available combinations.
Some parameters used to calculate each moving average can be customised:
→ Type : Specify the type of the moving average.
→ Length : Specify the number of periods used to calculate the moving average.
→ Source : Specify the source used to calculate the moving average.
→ Offset : Specify the offset to display the moving average on the chart.
The content provided by this indicator is for educational and informational purposes only. This indicator can not be considered as financial advice.
Historical performance based on this indicator do not guarantee any future result.
Trading is a risky activity and may involve losing money. Refer to a qualified financial advisor to get help and make appropriate financial decisions.